California Transitional Kindergarten – Education Finance and Education Policy
California Transitional Kindergarten Case Study
Education Finance and Education Policy
California’s share of the 2021 American Rescue Plan (about $43 billion), along with state reserves generated through tax policies targeting the wealthiest California residents, helps fund educational improvements including Universal TK.
Two key features of California’s system of public-school financing loom over education policy. The first is Proposition 98, which state voters approved in 1988 to address extreme inequities across the state’s public-school districts. Proposition 98 sets aside a mix of tax revenue that can be used exclusively for public institutions of education such as K–12 and community colleges. It also confers on the governor broad powers to shape education policy. Governor Newsom used this authority to include universal TK as part of a trailer in the state’s 2021–22 budget law, bypassing some level of legislative and public scrutiny of the proposal.
Despite the guaranteed funding stream provided through Proposition 98, the share of state spending allocated to public institutions has been threatened by a decline in K–12 enrollment that was underway before COVID. Considering this, the promise of added resources following 4-year-olds into public schools garnered support for universal TK from the California Teachers Association (CTA), the state’s largest teachers’ union. With 310,000 members, the CTA has a strong voice in state education policy. By tapping the vast Proposition 98 spending pool for universal TK, the state can help public schools recover from COVID impacts while offering early childhood educators better pay, increased job security, and generally better working conditions.
Deborah Stipek, emeritus professor at the Stanford Graduate School of Education, explains that bringing the early childhood workforce into K–12 environments “is a way to ensure that people caring for and teaching 4-year-olds are paid a living wage.”9Deborah Stipek, interviewed by Alice Porter, May 12, 2022. Stipek and other supporters of the universal TK approach contend that higher pay and benefits for K–12 teachers make for a more stable workforce. On average, California’s preschool teachers earn $16 an hour compared with $40 an hour for kindergarten teachers.
The second feature of California’s public school spending mechanism that drives early childhood policy is average daily attendance (ADA), which guides the allocation of public-school financing through the state to localities. The Berkeley Children’s Forum points out that gains in ADA represent an incentive “embedded” in the state’s school financing structure that can produce a resource infusion for school districts that embrace TK. During the 2021–22 school year, the forum estimates, a TK classroom with 20 children elicited $280,000 in state revenue for local districts. In addition, districts serving larger shares of disadvantaged children receive additional resources, which may partly explain why poorer urban districts have expanded TK more quickly than middle-class ones.
The budget law that established universal TK left a key financing problem unresolved: How will the state’s more than 100 basic aid districts support the program? Basic aid districts finance their K–12 activity entirely through taxes on high-value residential and commercial properties and not through the ADA-driven state formula. As of yet, these districts do not receive specific funding for TK. Many of these districts are in wealthy areas, but those that are not have large shares of low-income children. Fuller suggests that the state explore “surgical incentives” to support these children, such as providing TK financing for children from families with incomes below the federal poverty line.
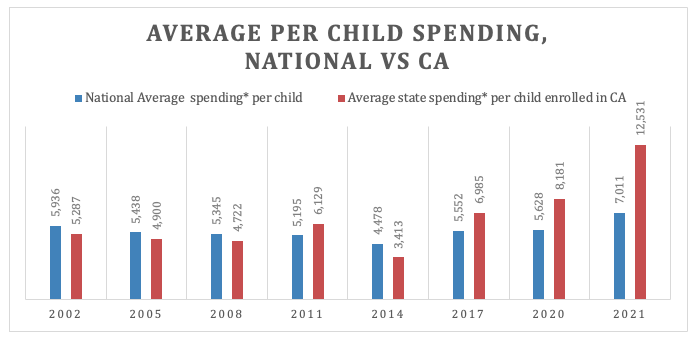
Figures 3 and 4 below use enrollment of 4-year-olds in California’s state-funded preschools and spending as reported in the 2021 NIEER yearbook compared to national enrollment and spending. The goal is to show how California’s method of preschool financing has driven both enrollment and per-capita spending in the state.