California Transitional Kindergarten – National Preschool Policy Trends
California Transitional Kindergarten Case Study
National Preschool Policy Trends
Forty-six states offer some form of publicly financed preschool, pre-kindergarten, or TK—through public schools, separate preschool systems, or a mixed-delivery system. Until the onset of the COVID-19 pandemic early in 2020, the share of 4-year-olds enrolled in some type of publicly financed preschool had been climbing for more than two decades, to a peak of 34%, according to the National Institute for Early Education Research (NIEER) State of Preschool 2021. If private preschool enrollment were added, the share of 4-year-olds enrolled in some type of academic program exceeds 70%. A year into the pandemic, the percentage of 4-year-olds in public programs had dropped to 29%. Nationwide, low-income children were most likely to lose access to preschool during the pandemic, according to the NIEER analysis. NIEER found sweeping disparities in enrollment across states, though several states have achieved stable programs.
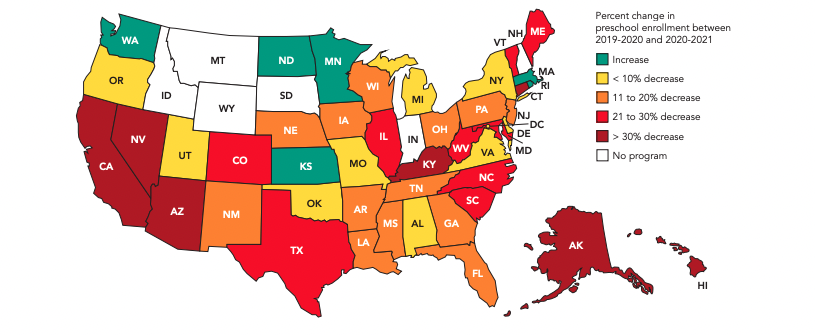
The following figure shows a collection of data taken from the NIEER 2021 State of Preschool Yearbook, to show trends in California’s pre-k/TK enrollment and those of other states:
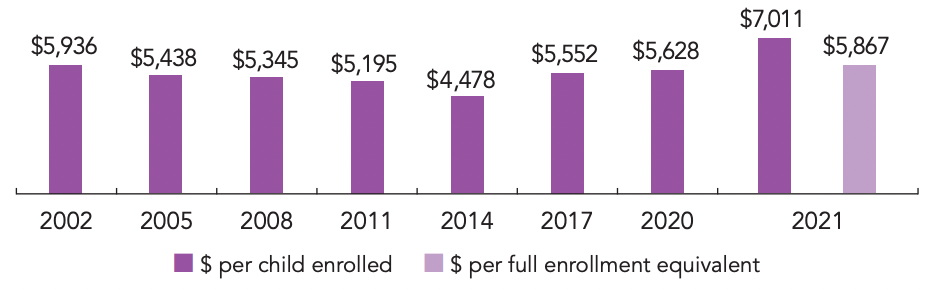
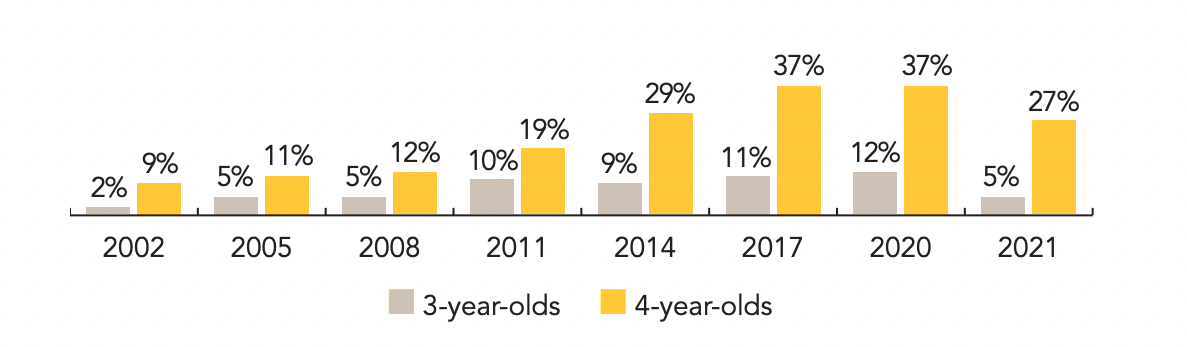
The following collections of charts show national trends in pre-k/TK enrollment and funding.
Preschool Enrollment Declined in Nearly Every State
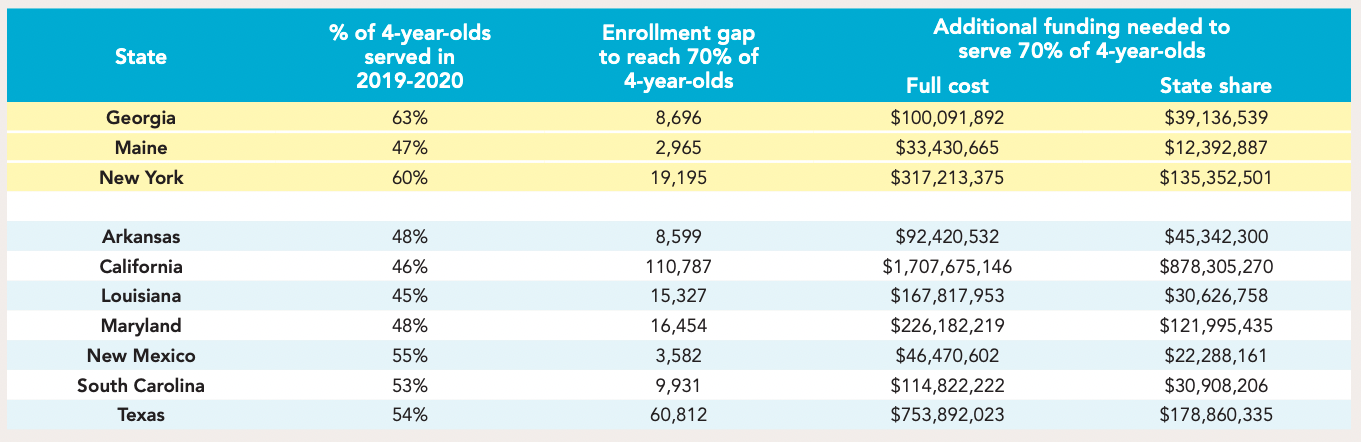
Ten States That are Close to Serving 70% of the 4-Year-Old Population
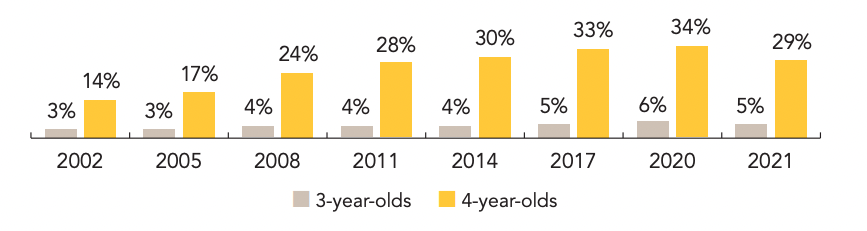
Percent of U.S. Population enrolled in State-Funded Preschool
Average State Spending Per Child Enrolled (2021 Dollars)
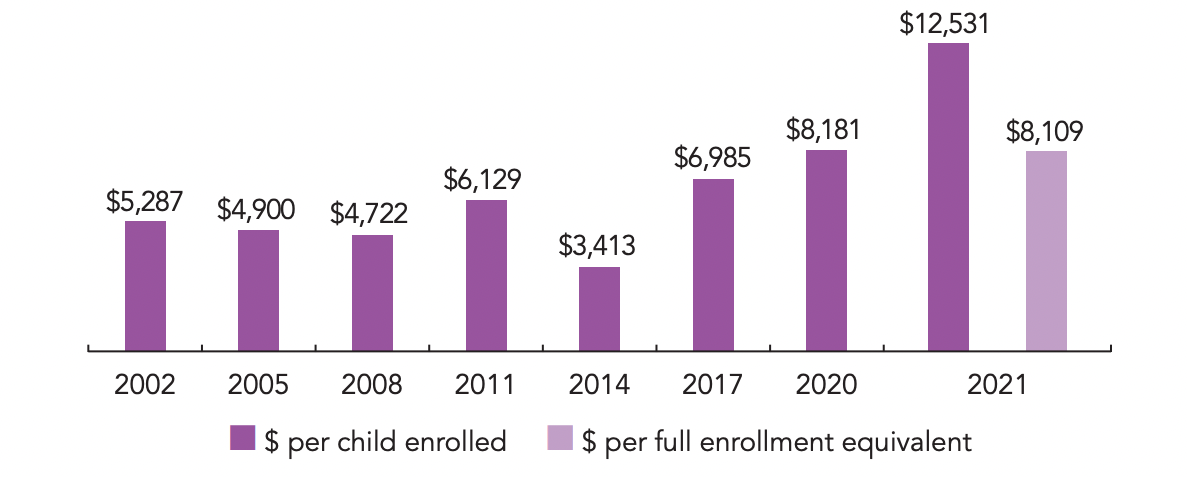
The following collections of charts are California pre-K/TK trends in enrollment and funding.
Percentage of State Population Enrolled
State Spending Per Child Enrolled (2021 Dollars)
Resources
- Total state pre-K spending: $1,968,721,367
- State Head Start spending: $0
- State spending per child enrolled: $12,531
- All reported spending per child enrolled*: $12,542
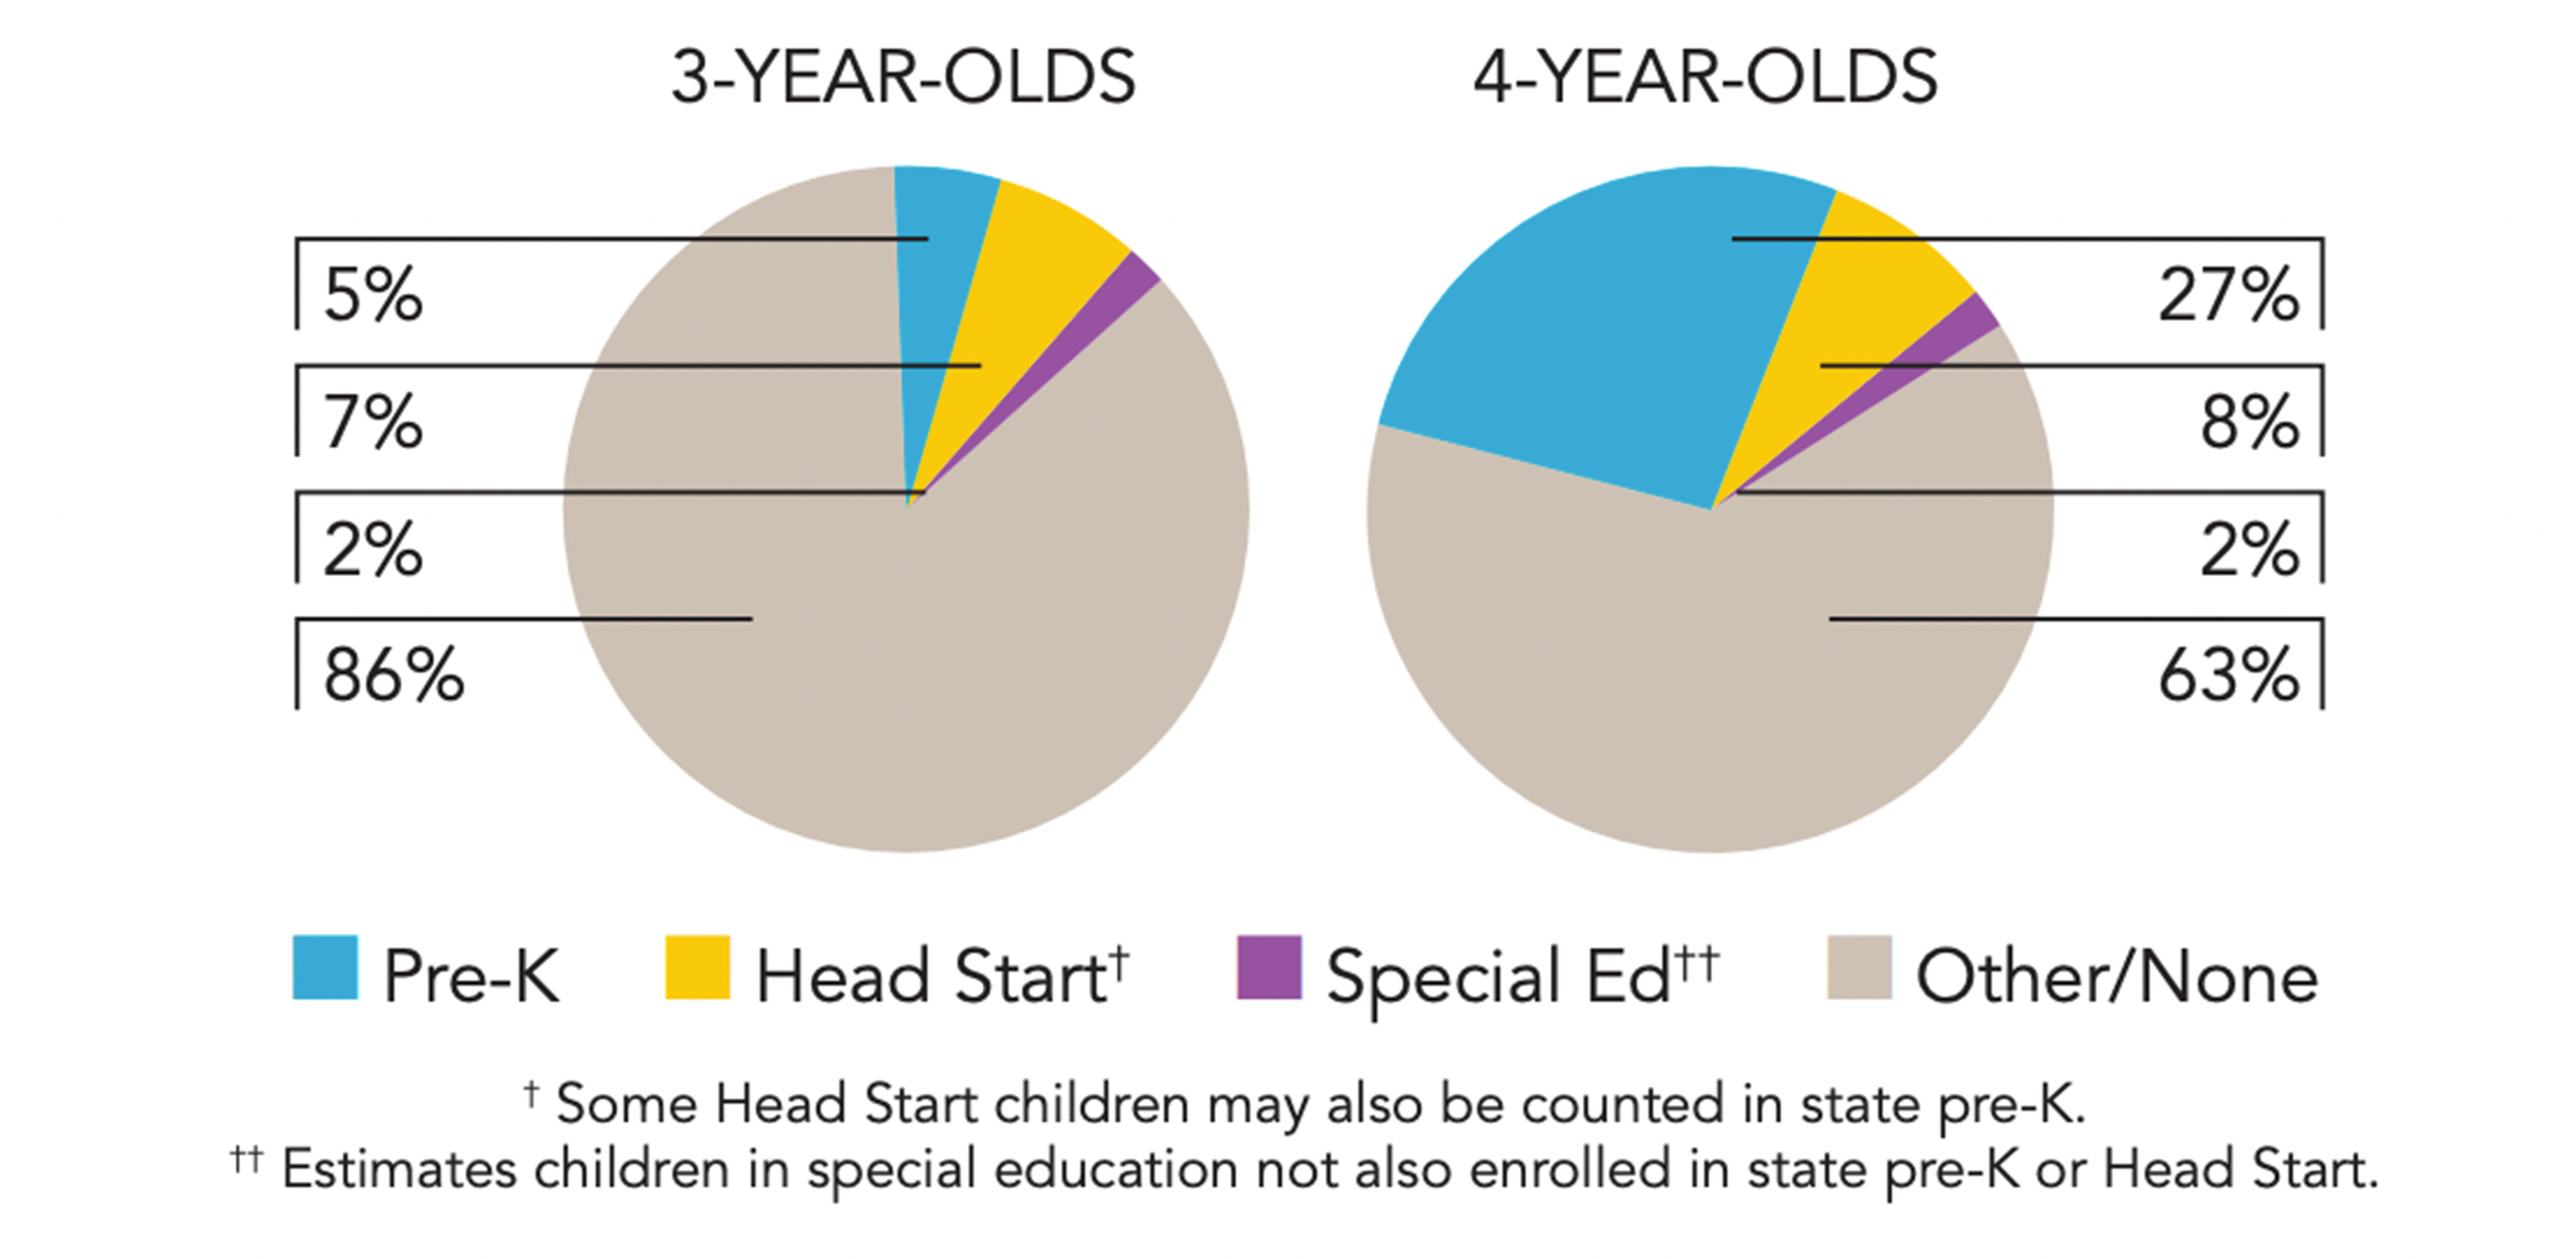
Percent of Population Enrolled in Public ECE
The Biden Administration has strongly supported public, universal pre-k, though the policy has not yet won congressional approval. Recent studies have generated mixed findings on its effectiveness in supporting school readiness and long-term performance, indicating successful outcomes in some cities and states but alarmingly poor long-term outcomes in others. Program quality varies widely, depending on application of evidence-based practices, financing, the balance of basic skills instruction vs. play, infrastructure, and many other variables. Quality remains a problem in California. As University of California (Berkeley) sociologist Bruce Fuller, a former education adviser to the California Legislature, acknowledges, “We’ve done well on access but it’s not clear how we’ve done on quality.”5Bruce Fuller, interviewed by Alice Porter, June 24, 2022.
Even states that have achieved significant enrollment gains in programs for 4-year-olds struggle to maintain quality programs. The following table, with information also taken from the NIEER 2021 yearbook, provides a brief description of eight state preschool programs* across the nation that have provided the most access to 4-year-olds. NIEER found, however, that the states with the highest enrollment do not necessarily show the strongest performance on NIEER’s quality benchmarks.6National Institute for Early Education Research. “The State of Preschool Yearbook 2021.” New Brunswick, N.J.: Rutgers University, 2021. NIEER quality benchmarks: teachers have bachelor’s degrees; teachers have specialized training in pre-K; assistant teachers have CDA or equivalent; professional development coaching for staff; class size of 20 students or fewer; staff-child ratio 1/10 or better; vision, hearing, health screenings, and referrals; curriculum supports; continuous quality.
| State Ranked by Pre-K Access to 4-Year-Olds | Performance on NIEER Quality benchmarks | Share of 4-Year-Olds Searved |
|---|---|---|
| Ranking 1. District of Columbia Washington, D.C., has offered some form of pre-k since the 1960s, and in 2021. The district also ranks first in the nation in spending, at more than $19,000 [BHS1] per “full enrollment equivalent.” The school day is mandated at 6.5 hours or more, five days a week. |
4/10 | 84% |
| Ranking 2. Oklahoma Oklahoma launched its Early Childhood Four-Year-Old Program in 1980 and mandated free preschool for all age-eligible children in 1998. All school districts in the state participate along with community-based programs. Enrollment and state spending on preschool both dropped significantly during the COVID epidemic. |
9/10 | 64% |
| Ranking 3. Iowa Iowa’s Statewide Voluntary Preschool Program, launched in 2007, is open to all 4-year-olds. Shared Visions, which dates from 1989, provides services to 3-5-year-olds through competitive grants to schools, nonprofit centers, and Head Start. The Iowa General Assembly has approved incentive awards to school districts that have increased preschool enrollment. |
7/10 | 59% |
| Ranking 4. Florida Florida voters approved an amendment to their state constitution in 2002, assuring pre-k access for all 4-year-olds. Florida’s Voluntary Prekindergarten Program enrolled 80% of 4-year-olds in the state in 2014, but that share had dropped steeply to 58% in 2021. Children attend public schools, accredited non-public schools, licensed childcare centers, accredited faith-based centers, and licensed family childcare homes. |
2/10 | 58% |
| Ranking 5. Vermont Since 2014, Vermont has required all its school districts to offer pre-k options. The state also uses contractual partnerships with public and private programs to expand access. Vermont’s program enrollment fell by 2,000 children from 2020 to 2021. The state closely monitors quality. |
7/10 | 57% |
| Ranking 6. West Virginia West Virginia approved legislation to mandate preschool for all 4-year-olds in the state by 2021. Today the state’s Universal Pre-k system serves all West Virginia counties and partners with childcare centers, private pre-k programs, and Head Start to meet demand. |
9/10 | 56% |
| Ranking 7. Wisconsin Wisconsin’s Constitution has required the state to provide free education to 4-year-olds since statehood was achieved in 1848. Public schools receive state grants for preschool, but they may subcontract for services with childcare centers, Head Start, and other community-based providers. The state served 56% of those eligible in 2021 but experienced an eight-percentage point drop from the previous year’s enrollment. |
3/10 | 56% |
| Ranking 8. Georgia The state’s Pre-k Program is financed by lottery. It experienced a 10- percentage point drop from its pre-COVID share in 2020. The instructional day is 6.5 hours, with before- and after-school care available in some areas. Demand often outstrips available spaces, and most participating programs maintain waiting lists. |
8/10 | 49% |
Source: NIEER 2021 Yearbook. NIEER defines a state preschool program as one that is financed, controlled, and directed by the state.
Citations
- 5. Bruce Fuller, interviewed by Alice Porter, June 24, 2022
- 6. National Institute for Early Education Research. “The State of Preschool Yearbook 2021.” New Brunswick, N.J.: Rutgers University, 2021. NIEER quality benchmarks: teachers have bachelor’s degrees; teachers have specialized training in pre-K; assistant teachers have CDA or equivalent; professional development coaching for staff; class size of 20 students or fewer; staff-child ratio 1/10 or better; vision, hearing, health screenings, and referrals; curriculum supports; continuous quality.